Developer-First Rural Land APIs
Powerful, flexible APIs for mapping and analyzing rural land — built for devs, data teams, and product innovators.
Multi-Industry Coverage
Agriculture, insurance, solar, wind, data centers, conservation, recreation, and more — one API platform for all rural land use cases.
Instant Mapping & Analytics
Integrate parcel, field, soil, crop, and boundary data into your apps — visualize, analyze, and automate in seconds.
Seamless Integration & Exports
Export maps, reports, and data for your workflows — embed in your platform or share with your team and clients.
Explore Our Geospatial Data Layers
Access authoritative datasets for rural land mapping through a single API — PLSS boundaries, CLU field boundaries, USDA Crop Data Layer, SSURGO soil survey data, tax parcels, and more.
Section-Township-Range (PLSS)
PLSS boundaries & MCD township names. Access section, township, and range data for land identification & mapping.
Field Boundaries (CLU)
2008 FSA CLU boundaries in developer-friendly API format. Identify & analyze agricultural field parcels.
Crop Data Layer (CDL)
NASS CDL datasets for API integration. Retrieve annual crop type classifications for any area.
Soil Data (SSURGO)
USDA NRCS SSURGO maps with state-specific productivity indices (CSR2, CPI, PI).
Parcels (Landowner Information)
Landowner tax parcel boundary data from public records. Access property boundaries & ownership information.
U.S. States
FreeState boundaries & labels in API-ready format. Supports state-level mapping and analysis.
U.S. Counties
FreeCounty boundaries & labels for easy API consumption. Enables county-level queries & visualization.
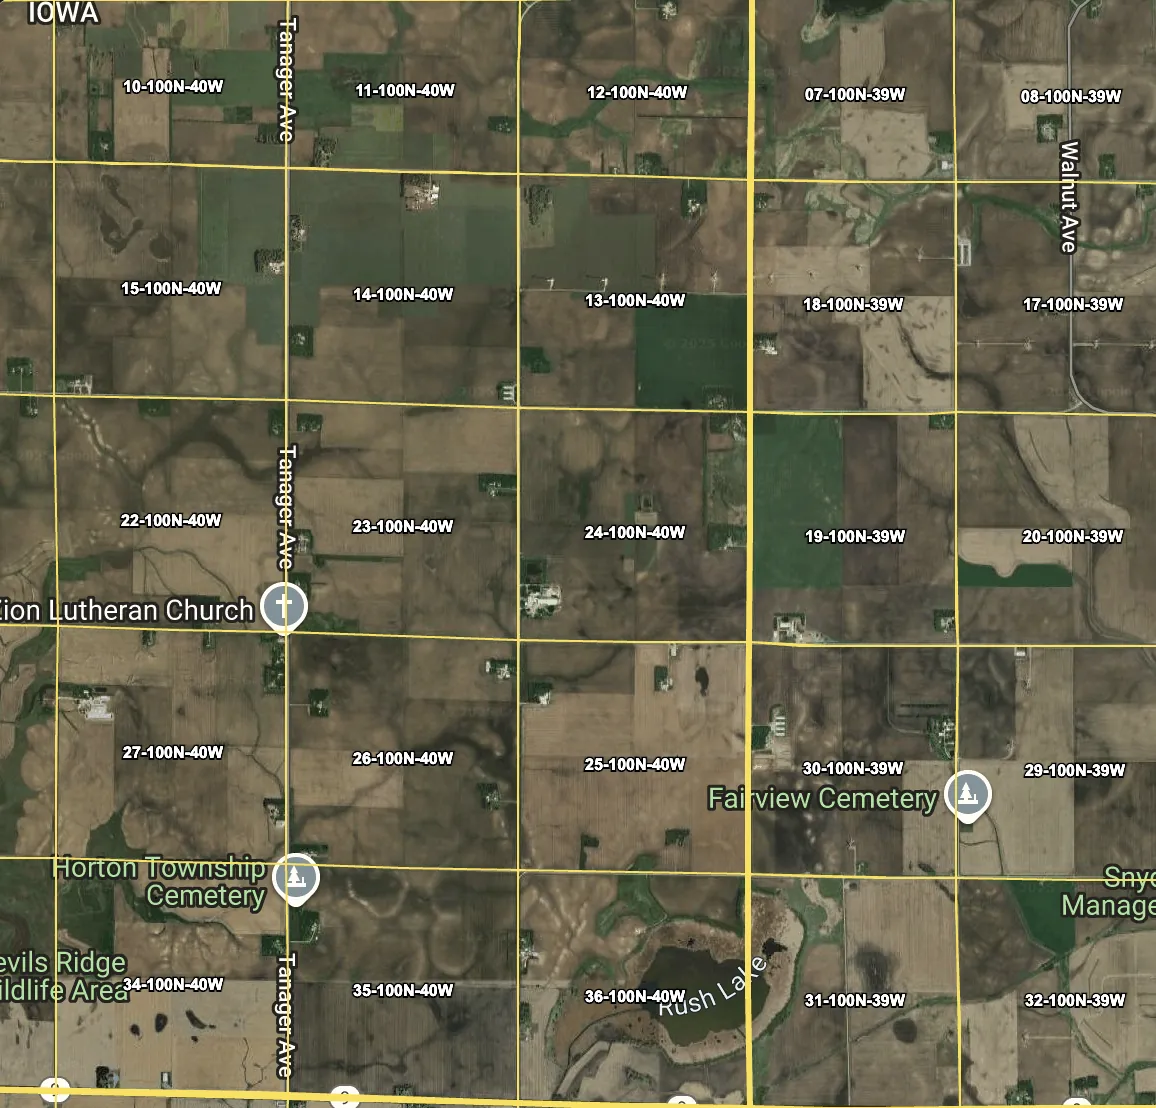
Section-Township-Range (PLSS) Boundaries
Access Public Land Survey System (PLSS) boundaries, including Minor Civil Division (MCD) township names. Identify land parcels by section, township, and range for precise mapping and legal descriptions.
// npm install landmapmagic
import { LandMap } from 'landmapmagic';

<LandMap
  apiKey="YOUR_API_KEY"
  initialVisibleLayers={['sections', 'townships']}
  initialCenter={[-93.63, 41.59]}
  initialZoom={12}
/>
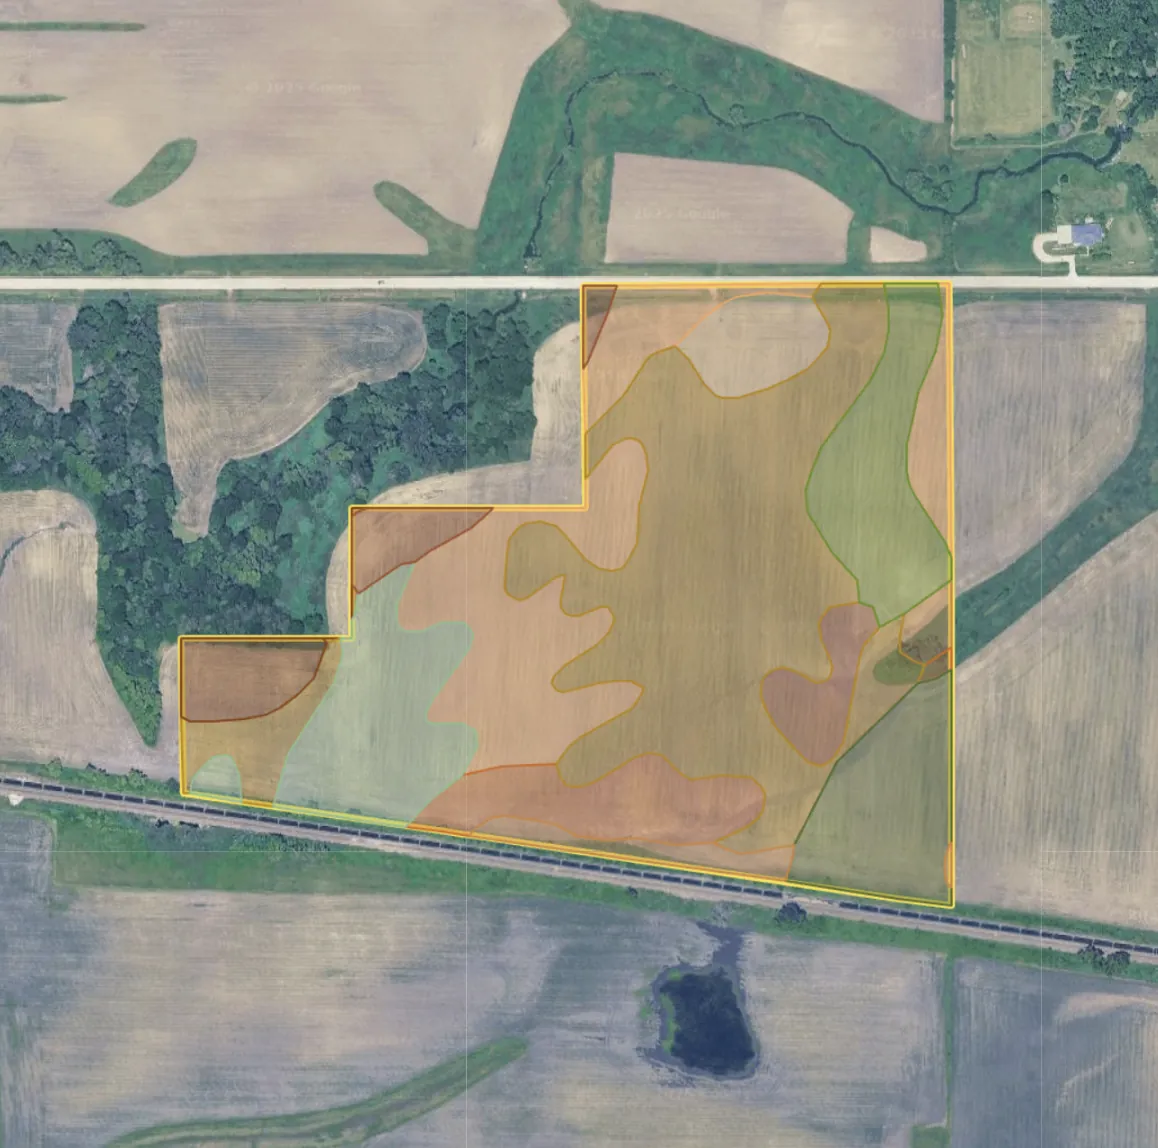
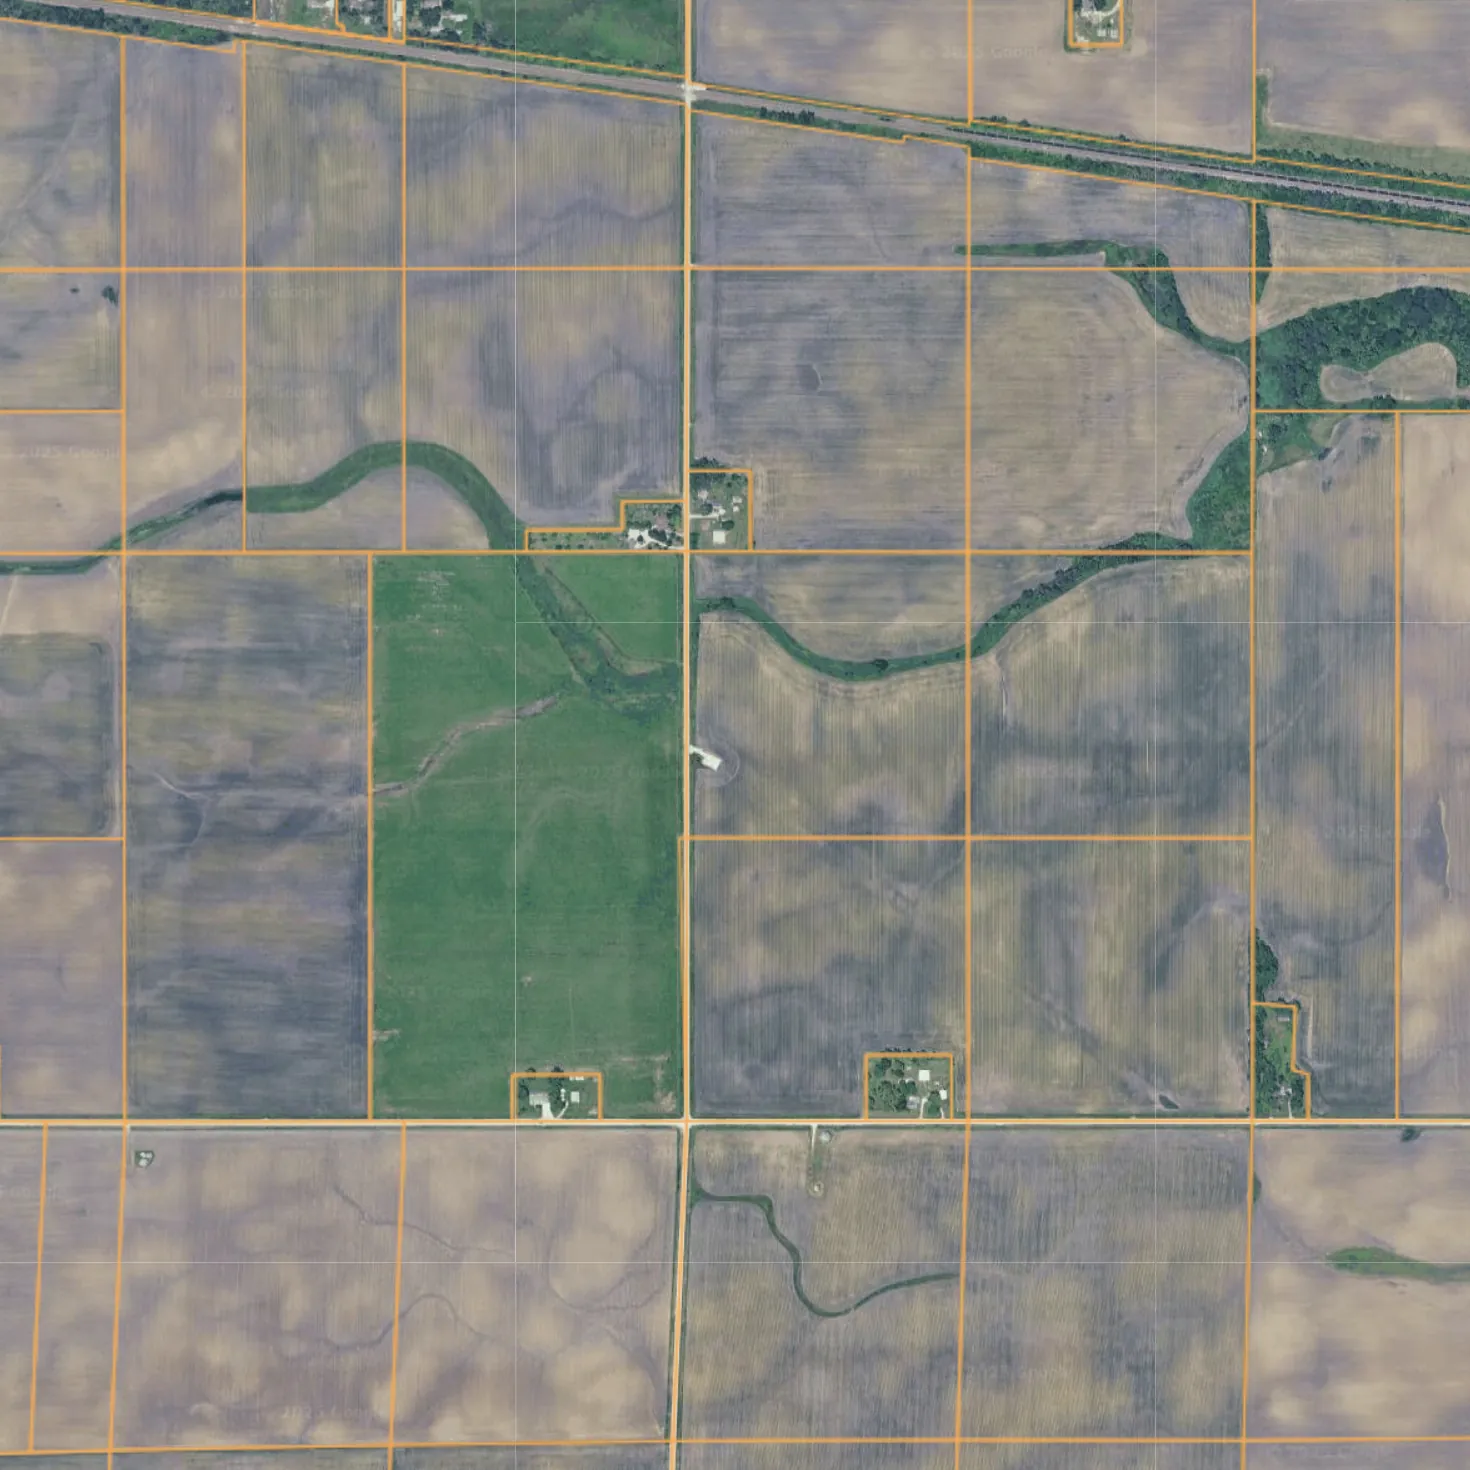
Field Boundaries (CLU)
Visualize 2008 FSA CLU (Common Land Unit) boundaries for agricultural fields. Perfect for identifying, analyzing, and exporting field parcels.
// npm install landmapmagic
import { LandMap } from 'landmapmagic';

<LandMap
  apiKey="YOUR_API_KEY"
  initialVisibleLayers={['clu']}
  initialCenter={[-93.63, 41.59]}
  initialZoom={14}
/>
Crop Data Layer (CDL)
Retrieve annual crop type classifications from NASS CDL datasets. Integrate crop data for any area of interest, year, or crop type.
// npm install landmapmagic
import { LandMap } from 'landmapmagic';

<LandMap
  apiKey="YOUR_API_KEY"
  initialVisibleLayers={['cdl']}
  initialCenter={[-93.63, 41.59]}
  initialZoom={14}
/>
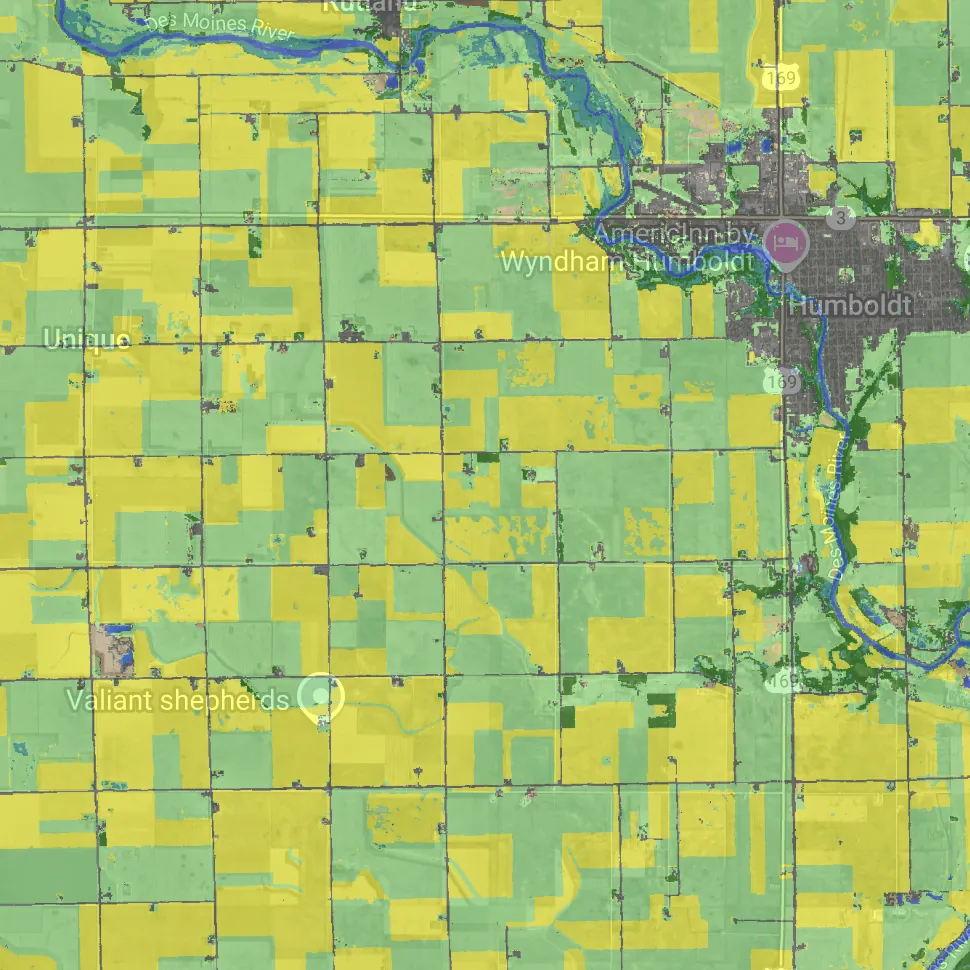
Soil Data (SSURGO + Productivity)
Access detailed soil properties and productivity indices (CSR2, CPI, PI) from USDA NRCS SSURGO. Instantly enhance your land analysis with state-specific soil ratings.
// npm install landmapmagic
import { LandMap } from 'landmapmagic';

<LandMap
  apiKey="YOUR_API_KEY"
  initialVisibleLayers={['ssurgo']}
  initialCenter={[-93.63, 41.59]}
  initialZoom={14}
/>
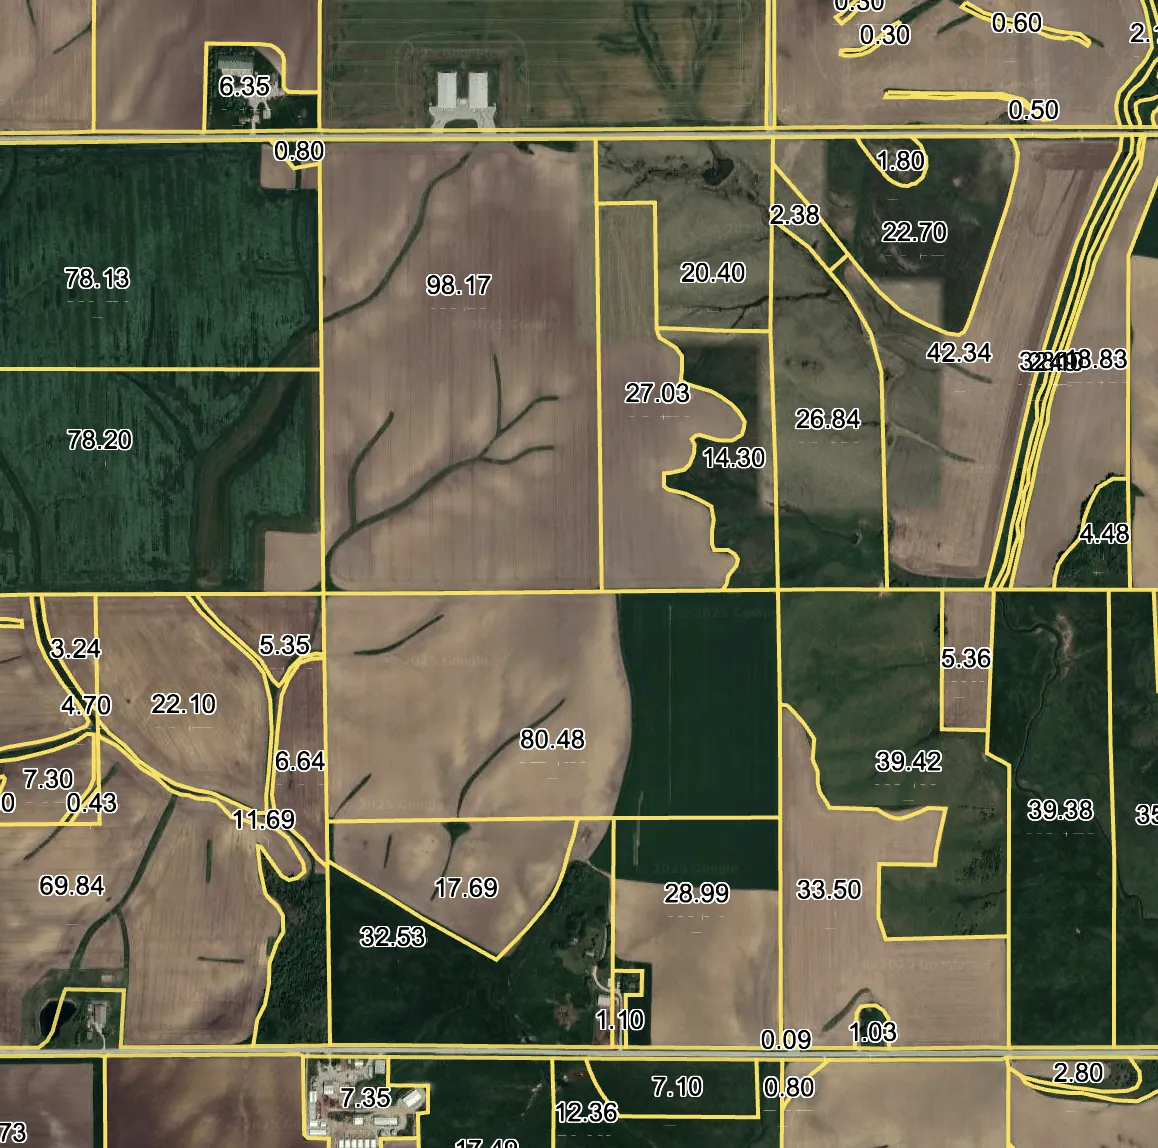
Tax Parcels (Landowner Information)
Access landowner tax parcel boundary data from public records. Integrate property boundaries and ownership information for comprehensive land analysis.
// npm install landmapmagic
import { LandMap } from 'landmapmagic';

<LandMap
  apiKey="YOUR_API_KEY"
  initialCenter={[-93.63, 41.59]}
  initialZoom={15}
/>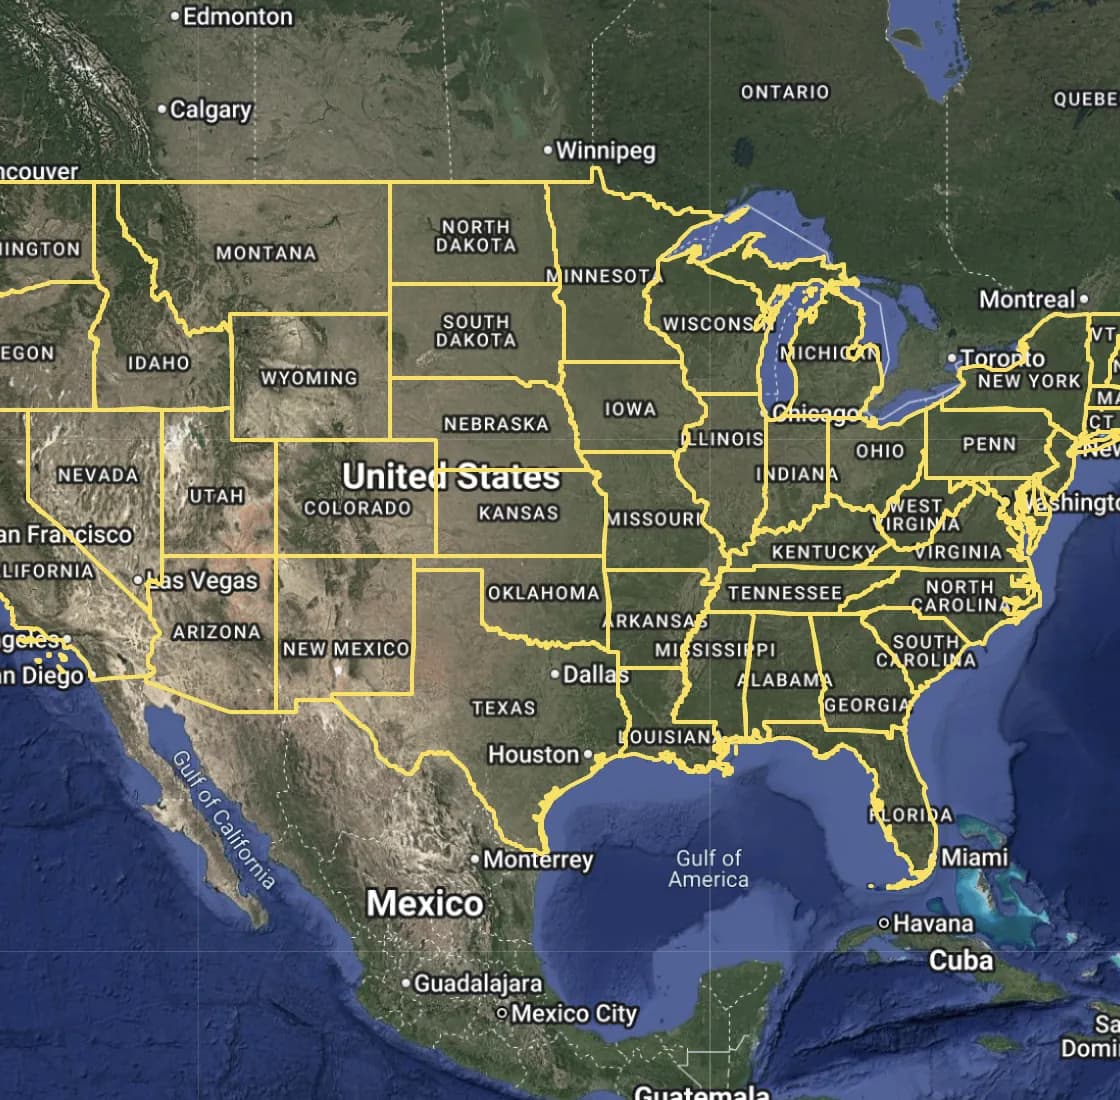
U.S. State Boundaries
FREEDisplay U.S. state boundaries and labels in a standardized, API-ready format. Supports state-level mapping and analysis.
// npm install landmapmagic
import { LandMap } from 'landmapmagic';

<LandMap
  apiKey="YOUR_API_KEY"
  initialVisibleLayers={['states']}
  initialZoom={4}
/>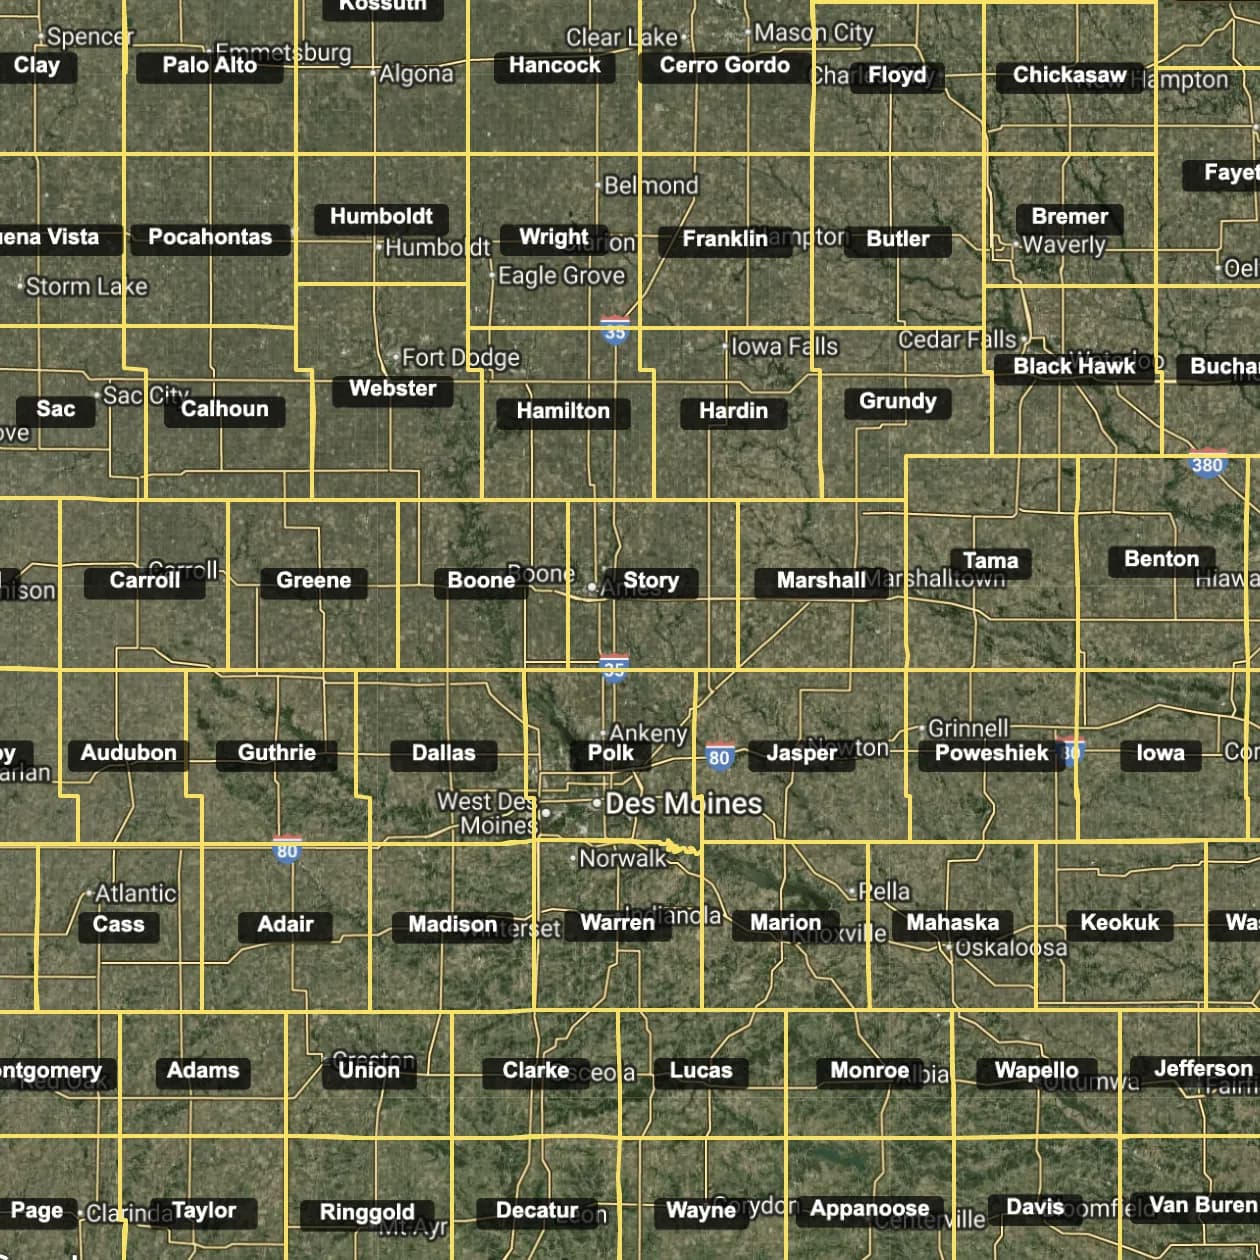
U.S. County Boundaries
FREEQuery and visualize U.S. county boundaries and labels. Easily integrate county-level data for mapping and analysis.
// npm install landmapmagic
import { LandMap } from 'landmapmagic';

<LandMap
  apiKey="YOUR_API_KEY"
  initialVisibleLayers={['counties']}
  initialZoom={7}
/>
Simple, Transparent Pricing
Industry-standard API pricing with flexible options. Start free, scale as you grow.
Free
10,000 tokens
14-day trial
- ✓All API endpoints
- ✓Email support
- ✓API documentation
- +Overage: Requires upgrade
Developer
POPULAR50,000 tokens/mo
- ✓Priority support
- ✓Advanced analytics
- ✓Higher rate limits
- +Overage: $0.0023/token
LandMap Magic: Questions & Answers
How does LandMap Magic help developers?
See how LandMap Magic's developer tools and APIs enable seamless integration of mapping capabilities into your applications.